
Our free futures P&L calculator helps traders estimate potential profits and losses when trading exchange-traded futures contracts. Calculate gross and net P&L, tick value, price movements, trading fees, margin requirements and potential risk before opening or closing a position.
The futures P&L calculator supports popular contracts, including E-mini and Micro E-mini S&P 500 (ES and MES), Nasdaq-100 (NQ and MNQ), WTI crude oil (CL and MCL), and gold futures (GC and MGC). Traders can also enter custom contract specifications for additional USD-denominated products.
Enter your futures contract, number of contracts, trade direction, entry price and exit price to estimate the financial outcome of a Long or Short position. You can also include broker commissions, other trading costs, Stop-Loss and Take-Profit levels to evaluate potential net risk and reward.
The calculator uses user-entered prices and contract specifications rather than live market data. Margin estimates depend on the requirements you enter, and actual trading results may differ because of fees, slippage, exchange rules and market conditions.
FREE INTERACTIVE FUTURES TOOL
Futures P&L Calculator
Estimate futures profit or loss, tick value, trading fees, stop-loss risk and margin for exchange-traded contracts.
Results
Enter valid trade details to see estimates.
Educational estimates only, not investment advice. Presets are illustrative and may differ by contract month, product conventions or exchange updates; verify the exact outright contract specs and tick increments with CME Group and your broker. USD-denominated price × multiplier contracts only. All prices are user-entered, not live quotes. P&L uses a constant contract multiplier and assumes full fills at the entered prices; no partial closes, variable tick schedules, FX conversion, slippage, financing, taxes or unentered fees. Fees are charged per contract on entry and exit; other costs apply once to the whole trade. Stop-loss execution is not guaranteed. Broker margin is manually entered collateral, not maximum loss; no liquidation prices are calculated.
How to Use the Futures P&L Calculator
Our free futures P&L calculator helps traders estimate potential profits and losses when trading futures contracts. Whether you trade stock index futures, crude oil or gold, the calculator provides useful information about position value, tick size, trading costs, margin and risk.
Unlike spot cryptocurrency trading, exchange-traded futures use standardized contract specifications. Each contract has its own multiplier, minimum tick size and tick value. Understanding these values is essential for calculating futures trading profits and losses correctly.
Follow the steps below to calculate a potential futures trade.
Step 1: Select Your Futures Contract
Start by choosing the futures contract you want to trade.
The calculator includes popular futures instruments such as:
- ES — E-mini S&P 500
- MES — Micro E-mini S&P 500
- NQ — E-mini Nasdaq-100
- MNQ — Micro E-mini Nasdaq-100
- CL — WTI Crude Oil
- MCL — Micro WTI Crude Oil
- GC — Gold Futures
- MGC — Micro Gold Futures
Each preset provides example contract specifications, including the contract multiplier and minimum tick size.
You can also select a custom USD-denominated contract and enter its specifications manually.
Always verify the exact contract details with your broker or futures exchange before placing a trade.
Step 2: Enter the Number of Contracts and Trade Direction
Enter how many futures contracts you plan to trade.
For example, trading two Micro E-mini S&P 500 (MES) contracts provides twice the monetary exposure of trading one MES contract at the same price.
Next, select your trade direction.
Buy / Long: You expect the futures price to rise. A price increase generates a gross profit, while a decline generates a gross loss.
Sell / Short: You expect the futures price to fall. A price decrease generates a gross profit, while an increase generates a gross loss.
The futures P&L calculator adjusts its calculations according to the selected direction.
Step 3: Enter the Entry and Exit Prices
Enter the price at which you opened or plan to open the futures position.
Then enter your expected exit price.
For a Long position:
Gross P&L = (Exit Price − Entry Price) × Contract Multiplier × Number of Contracts
For a Short position:
Gross P&L = (Entry Price − Exit Price) × Contract Multiplier × Number of Contracts
For example, suppose a trader buys two MES contracts at 6,000 and closes the position at 6,015.
Each MES contract has a multiplier of $5 per index point.
Gross P&L = (6,015 − 6,000) × $5 × 2
Gross Profit = +$150
This result represents the estimated profit before trading fees and other expenses.
Step 4: Understand Contract Multipliers and Tick Values
Futures contracts have standardized price increments called ticks.
The minimum tick size represents the smallest permitted price movement for a particular contract.
The monetary value of one tick depends on the contract multiplier.
Tick Value per Contract = Minimum Tick Size × Contract Multiplier
For MES futures:
Minimum Tick Size = 0.25 index points
Contract Multiplier = $5 per index point
Tick Value = 0.25 × $5
Tick Value per MES Contract = $1.25
For two MES contracts:
Tick Value per Position = $2.50
If the price moves by 15 index points, this represents 60 ticks.
A favorable movement of 60 ticks across two MES contracts generates:
Gross P&L = 60 × $2.50
Gross Profit = $150
Tick values differ between futures products. Never assume that all contracts use the same multiplier or tick size.
Step 5: Include Trading Fees and Other Costs
Trading expenses reduce the final profitability of futures positions.
The calculator allows you to enter the entry and exit fees charged per contract, as well as additional trading expenses.
Total Trading Costs = (Entry Fee per Contract + Exit Fee per Contract) × Number of Contracts + Other Costs
For example, assume a broker charges $1.25 per contract to open a position and $1.25 per contract to close it.
For two MES contracts:
Entry Fees = $1.25 × 2 = $2.50
Exit Fees = $1.25 × 2 = $2.50
Total Trading Costs = $5.00
The estimated net profit is then calculated using:
Net P&L = Gross P&L − Total Trading Costs
Net P&L = $150 − $5
Net Profit = +$145
Remember that actual trading expenses may include additional brokerage commissions, exchange fees, regulatory fees and slippage.
Step 6: Enter Stop-Loss and Take-Profit Prices
Risk management is an important part of futures trading.
The futures P&L calculator allows you to enter optional Stop-Loss and Take-Profit levels to estimate potential losses and gains.
For a Long position, the Stop-Loss should normally be below the entry price, while the Take-Profit should be above it.
For a Short position, these levels are reversed.
Consider the previous MES example:
Entry Price = 6,000
Stop-Loss Price = 5,990
Take-Profit Price = 6,020
Number of Contracts = 2
At the Stop-Loss level:
Gross Loss = (5,990 − 6,000) × $5 × 2
Gross Loss = −$100
After $5 in trading fees:
Estimated Net Loss at Stop = −$105
At the Take-Profit level:
Gross Profit = (6,020 − 6,000) × $5 × 2
Gross Profit = +$200
After $5 in trading fees:
Estimated Net Profit at Target = +$195
These results assume the selected prices are achieved. Stop-Loss orders do not guarantee execution at the specified price.
Step 7: Calculate the Risk/Reward Ratio
The risk/reward ratio compares the estimated potential gain with the estimated potential loss.
Net Risk/Reward Ratio = Potential Net Profit at Target / Absolute Potential Net Loss at Stop
Using our MES example:
Risk/Reward = $195 / $105
Risk/Reward Ratio ≈ 1:1.86
This means the potential net reward is approximately 1.86 times the estimated risk.
A favorable risk/reward ratio does not guarantee a profitable trading strategy. The probability of winning, trading costs and market conditions also affect long-term results.
Step 8: Estimate Margin Requirements and Return on Margin
Futures brokers require traders to maintain margin for open positions.
Margin is collateral, not the total notional value of a futures position.
If your broker requires $2,000 of margin per MES contract, trading two contracts requires:
Estimated Total Margin = Margin per Contract × Number of Contracts
Estimated Total Margin = $2,000 × 2
Estimated Total Margin = $4,000
You can estimate the return relative to this margin using:
Net P&L / Margin (%) = (Net P&L / Estimated Total Margin) × 100
Return = ($145 / $4,000) × 100
Estimated Return on Margin = +3.63%
This calculation does not mean your maximum possible loss is limited to the deposited margin.
Futures losses can exceed the initial margin, and margin requirements can change depending on market conditions, the broker and the exchange.
Important Considerations When Trading Futures
Futures trading involves leverage and substantial financial risk.
The contract’s notional value can be significantly larger than the amount of margin required to open a position.
Before placing a futures trade, verify the contract multiplier, minimum tick size, quotation units, expiration month, commissions and broker margin requirements.
Our futures P&L calculator uses user-entered prices and contract details. It does not provide real-time exchange quotations or guarantee order execution.
All results are educational estimates. Actual trading outcomes can differ because of market volatility, slippage, commissions, price gaps and changes in margin requirements.
Futures P&L Calculator Example (MES)
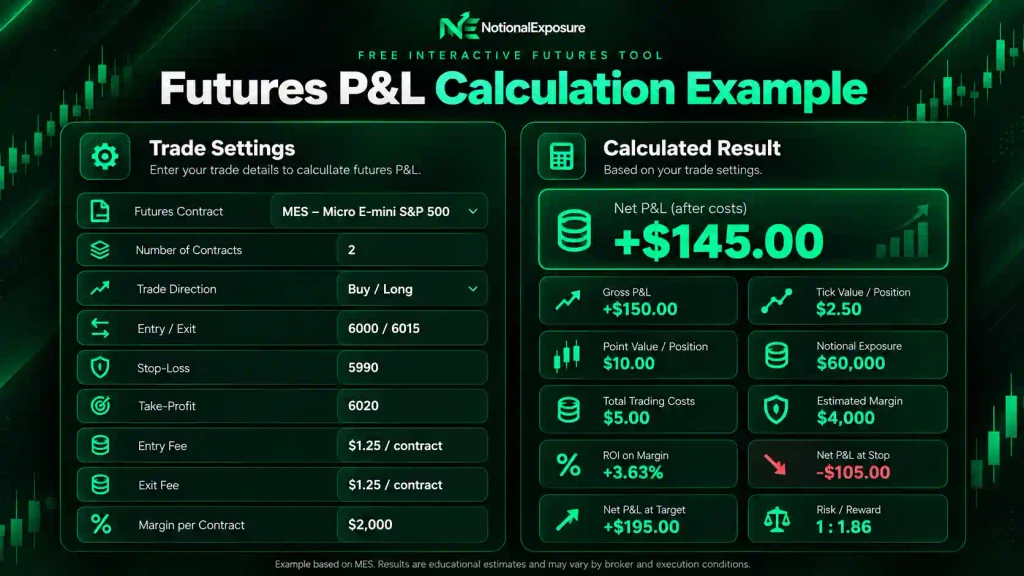
Let’s examine a practical futures trading example using the free futures P&L calculator on Notional Exposure.
This example demonstrates how to calculate futures profits and losses, tick values, trading fees, margin requirements and risk/reward ratios when trading Micro E-mini S&P 500 (MES) futures.
We will use a hypothetical Buy / Long position involving two MES contracts. All prices and margin figures are illustrative and do not represent live market conditions.
Example Trade Settings
- Futures Contract: MES — Micro E-mini S&P 500
- Number of Contracts: 2
- Trade Direction: Buy / Long
- Entry Price: 6,000
- Exit Price: 6,015
- Contract Multiplier: $5 per index point
- Minimum Tick Size: 0.25 points
- Stop-Loss Price: 5,990
- Take-Profit Price: 6,020
- Entry Fee: $1.25 per contract
- Exit Fee: $1.25 per contract
- Other Costs: $0
- Margin per Contract: $2,000
Step 1: Calculate Futures Contract Value
The notional value of a futures position represents its market exposure, not the cash required to open the trade.
Contract Value = Futures Price × Contract Multiplier
For one MES contract:
Contract Value = 6,000 × $5
Value per Contract = $30,000
For two MES contracts:
Total Notional Exposure = $30,000 × 2
Total Notional Exposure = $60,000
This means the trader controls a futures position representing $60,000 of notional exposure at the entry price.
Step 2: Calculate Tick Value and Price Movement
MES futures have a minimum tick size of 0.25 index points and a contract multiplier of $5 per point.
Tick Value = Minimum Tick Size × Contract Multiplier
Tick Value = 0.25 × $5
Tick Value per Contract = $1.25
For two contracts:
Tick Value per Position = $1.25 × 2
Tick Value per Position = $2.50
The futures price increases from 6,000 to 6,015.
Price Movement = 6,015 − 6,000
Price Movement = +15 points
Number of Ticks = 15 / 0.25
Ticks Moved = +60 ticks
Step 3: Calculate Gross Futures P&L
For a Buy / Long position, a price increase creates a gross trading profit.
Gross P&L = (Exit Price − Entry Price) × Contract Multiplier × Number of Contracts
Gross P&L = (6,015 − 6,000) × $5 × 2
Gross P&L = 15 × $10
Gross Profit = +$150.00
We can verify this result using ticks:
Gross P&L = 60 ticks × $2.50 per tick
Gross Profit = +$150.00
Both methods produce the same result.
Step 4: Calculate Trading Fees
Trading commissions and fees reduce the amount of profit a futures trader keeps.
In this example, the broker charges $1.25 per contract when entering and exiting the position.
Entry Fees = Entry Fee per Contract × Number of Contracts
Entry Fees = $1.25 × 2
Total Entry Fees = $2.50
Exit Fees = Exit Fee per Contract × Number of Contracts
Exit Fees = $1.25 × 2
Total Exit Fees = $2.50
Total Trading Costs = $2.50 + $2.50
Total Trading Costs = $5.00
These example fees are illustrative. Actual broker and exchange charges can vary.
Step 5: Calculate Net Futures P&L
Net P&L measures the trading result after deducting the costs entered into the calculator.
Net P&L = Gross P&L − Total Trading Costs
Net P&L = $150.00 − $5.00
Net Profit = +$145.00
The position produces $150 in gross profit, but the estimated result after the entered trading fees is $145.
Actual results may differ because of slippage, additional commissions and execution conditions.
Step 6: Calculate Potential Loss at Stop-Loss
The trader chooses a Stop-Loss price of 5,990, which is 10 index points below the entry price.
Gross P&L at Stop = (Stop-Loss Price − Entry Price) × Multiplier × Contracts
Gross P&L at Stop = (5,990 − 6,000) × $5 × 2
Gross Loss at Stop = −$100.00
After deducting the assumed $5 in trading costs:
Net P&L at Stop = −$100 − $5
Estimated Net Loss at Stop = −$105.00
This result assumes the position can be closed at the selected Stop-Loss price. Price gaps and slippage can cause a larger loss.
Step 7: Calculate Potential Profit at Take-Profit
The trader sets a Take-Profit level of 6,020, which is 20 points above the entry price.
Gross P&L at Target = (Take-Profit Price − Entry Price) × Multiplier × Contracts
Gross P&L at Target = (6,020 − 6,000) × $5 × 2
Gross Profit at Target = +$200.00
After deducting $5 in trading costs:
Net P&L at Target = $200 − $5
Estimated Net Profit at Target = +$195.00
This is the potential result if the position closes at the specified Take-Profit price.
Step 8: Calculate the Risk/Reward Ratio
The risk/reward ratio compares the potential net reward at Take-Profit with the estimated net loss at Stop-Loss.
Risk/Reward Ratio = Net Profit at Target / Absolute Net Loss at Stop
Risk/Reward Ratio = $195 / $105
Risk/Reward Ratio ≈ 1:1.86
For every $1 of estimated risk, the trade offers approximately $1.86 of potential reward after the entered fees.
A favorable ratio does not guarantee profitability because the probability of reaching each price level also matters.
Step 9: Calculate Margin and Return on Margin
Assume the broker requires $2,000 in margin per MES contract.
Total Margin = Margin per Contract × Number of Contracts
Total Margin = $2,000 × 2
Estimated Total Margin = $4,000
The return on margin is calculated using the estimated net profit from the exit scenario.
Return on Margin (%) = (Net P&L / Total Margin) × 100
Return on Margin = ($145 / $4,000) × 100
Estimated Return on Margin = +3.63%
The position has $60,000 in notional exposure while using $4,000 in estimated margin.
Margin is collateral, not a maximum-loss limit. Futures losses can exceed the initial margin, and broker requirements can change.
What Does This Futures P&L Example Show?
This MES trading example demonstrates how futures contract specifications, price movements and transaction costs influence trading results.
Buying two MES contracts at 6,000 and closing the position at 6,015 produces a gross profit of $150 and an estimated net profit of $145 after the entered trading costs.
The selected Stop-Loss and Take-Profit levels produce an estimated net risk of $105 and a potential net reward of $195, resulting in a risk/reward ratio of approximately 1:1.86.
The example also illustrates the difference between notional exposure and required margin.
Traders should verify contract specifications and broker requirements before opening futures positions. All calculations are educational estimates and do not guarantee trading results.
Futures P&L Calculator — Frequently Asked Questions
What is a futures P&L calculator?
A futures P&L calculator is a trading tool that estimates the potential profit or loss of a futures position based on the entry price, exit price, contract multiplier and number of contracts.
Our free futures P&L calculator also includes trading fees, tick values, margin estimates, Stop-Loss and Take-Profit scenarios.
It supports popular index, energy and metals futures, including ES, MES, NQ, MNQ, CL, MCL, GC and MGC.
The results help traders evaluate possible outcomes before placing a trade, but they do not guarantee execution prices or future profitability.
How do I calculate profit and loss in futures trading?
Futures profit and loss depend on the price movement, contract multiplier, number of contracts and trade direction.
For a Long position:
Gross P&L = (Exit Price − Entry Price) × Contract Multiplier × Number of Contracts
For a Short position:
Gross P&L = (Entry Price − Exit Price) × Contract Multiplier × Number of Contracts
For example, buying two Micro E-mini S&P 500 (MES) contracts at 6,000 and selling them at 6,015 creates a 15-point gain.
With a $5 multiplier per point:
Gross P&L = 15 × $5 × 2
Gross Profit = $150
Trading commissions and other expenses must be deducted to calculate net P&L.
What is the difference between gross P&L and net P&L?
Gross P&L represents the profit or loss generated by a futures price movement before trading costs.
Net P&L represents the estimated result after deducting the expenses entered into the calculator.
Net P&L = Gross P&L − Total Trading Costs
For example, if a futures trade generates $150 in gross profit and the total entered fees are $5:
Net P&L = $150 − $5
Net Profit = $145
Actual results may differ because of additional commissions, exchange fees, slippage and execution conditions.
What is tick value in futures trading?
A tick is the minimum permitted price movement for a particular futures contract.
Each futures product has a specified minimum tick size and monetary tick value.
Tick Value = Minimum Tick Size × Contract Multiplier
For example, the Micro E-mini S&P 500 (MES) futures contract has a minimum tick size of 0.25 index points and a multiplier of $5 per point.
Tick Value = 0.25 × $5
Tick Value per MES Contract = $1.25
For a position containing three MES contracts, one tick represents a $3.75 change in gross P&L.
Different futures contracts have different tick values, so traders should verify the specifications of each instrument.
How does futures margin affect trading profit and loss?
Futures margin is collateral required to maintain a futures position. It is not the same as the total notional value of the contract.
Margin requirements depend on the exchange, clearing arrangements, broker and market conditions.
For example, if the broker requires $2,000 per MES contract, two contracts require an estimated $4,000 in margin.
A trade producing $145 in net profit would generate an estimated return on margin of:
Return on Margin = ($145 / $4,000) × 100 = 3.63%
However, a trader’s maximum potential loss is not limited to the initial margin. Futures trading involves leverage and can result in losses exceeding the margin deposited.
Can I calculate futures profits for both Long and Short positions?
Yes. The futures P&L calculator supports Buy / Long and Sell / Short trading scenarios.
For a Long position, a rising futures price generates a gross profit, while a falling price generates a gross loss.
For a Short position, a falling futures price generates a gross profit, while a rising price generates a gross loss.
For example, selling three MES contracts at 6,000 and closing them at 5,980 produces:
Gross P&L = (6,000 − 5,980) × $5 × 3
Gross Profit = $300
If the total entered trading costs are $7.50, the estimated net profit is $292.50.
Both trading directions can involve substantial risk.
Does the futures P&L calculator include Stop-Loss and Take-Profit levels?
Yes. You can enter optional Stop-Loss and Take-Profit prices to estimate potential losses and gains for your futures position.
For a Long position, the Stop-Loss should be below the entry price, while the Take-Profit should be above it.
For a Short position, the Stop-Loss should be above the entry price, while the Take-Profit should be below it.
The calculator also estimates the net risk/reward ratio using the potential net loss at Stop-Loss and potential net profit at Take-Profit.
These results assume execution at the entered levels. Real orders may experience slippage, price gaps or other execution differences, especially during volatile markets.
Does the futures P&L calculator use real-time market prices?
No. The calculator does not automatically retrieve live futures prices.
It uses the entry price, exit price, contract specifications, commissions and other values provided by the user.
The built-in contract presets provide a convenient starting point, but traders should verify the exact contract specifications, quotation units, trading month and broker requirements.
The tool does not forecast future prices, guarantee order execution or determine the maximum possible loss of a futures position.
All results are educational estimates rather than personalized investment advice.
Explore more free trading calculators on Notional Exposure to improve your trade planning and risk management.
Use our Futures Contract Value Calculator to estimate notional exposure, contract multipliers, tick values and margin requirements for futures positions.
You can also use our Risk Reward Calculator to compare potential trading gains and losses, evaluate stop-loss and take-profit levels, and calculate break-even win rates.
If you trade cryptocurrencies, our Crypto P&L Calculator helps estimate trading profits, losses, fees and return on margin for spot and USDT-margined futures positions.
Browse all available tools in our Trading Calculators directory.
For official information about Micro E-mini futures contract specifications, read Step 1: Calculate Futures Contract Value.. CME Group explains how contract multipliers, minimum tick sizes and tick values work, including the $5-per-point multiplier and $1.25 tick value of MES futures.
Understanding these specifications helps traders calculate notional exposure, potential profit or loss and position risk more accurately. Always verify current exchange and broker requirements before trading.